Data is only as valuable as your ability to understand it. UBX’s Data Visualization system makes it easy to understand your building’s sensor and control data, even if you’re not a data scientist. The system provides a wide range of Data Visualization options out of the box, allowing you to gain valuable insights into your building’s past and present performance.
Here are some of the benefits of using UBX for Data Visualization:
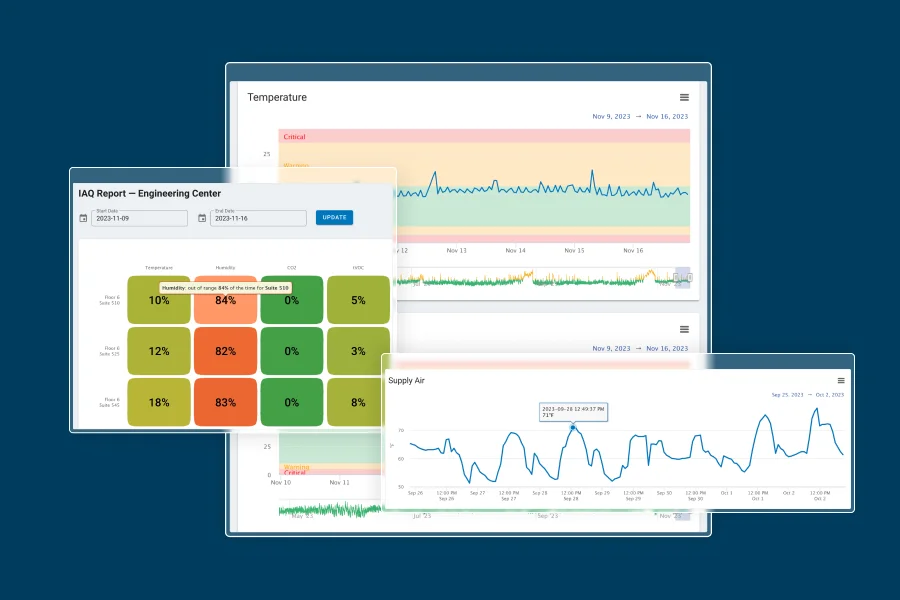
UBX’s built-in dashboards for common reports, such as refrigeration, indoor air quality, occupant comfort, and energy usage, support your KPI goals and meet compliance Reporting requirements. It transforms complex data sets into easy-to-understand visual representations, helping you make sense of your data and uncover valuable insights.

For example, you can use UBX to view a heatmap of all sensors of the same type in a building to get a holistic understanding of your entire building’s performance. You can also export reports or raw monitoring data in CSV format for external analytics tools or to build more complicated compliance reports.
In addition, with UBX’s ability to aggregate data sets from multiple sensor groups, facility managers are able to compare multiple buildings and gain unique insights about their entire portfolio under management.
UBX’s Data Visualization system is the perfect way to make sense of your building’s sensor and control data. The system is easy to use, powerful, flexible, and scalable. It can be used to create reports, dashboards, and presentations for a variety of purposes. If you’re looking for a way to understand your building’s data and make better decisions, then UBX is the perfect solution for you.
To learn more about UBX and how it can help you understand your building’s data and make better decisions, please contact our team for a live demonstration or additional information.
Read the next part in the series to learn more about UBX:
Part 4: Integrated Asset Manager with UBX